

This week, I make weather radio which I made on first week to a chrome extension.
Next, I'd like to make some animated icon istead of using static icon, and add weather status of following hours to the extension. Here's three icon I made this week using CSS Animation, and want to make more for different weather status.
Update: this week I try to figure out the why the blur effect didn't wort, and it truns out the external library sequence is wrong so I changed order of them with Cory's help, and it works now :D -- Febrary 14
This week's assignment--
Make a bookmarklet that works against the user. It might make links harder to see/click (change color, move them around), remove form elements, put image/div on top of page, etc, make it less informative/useful. Interpret this how you like. It can be a bookmarklet that works generically on (most) sites, or one that is tailored for a specific site.
For this week's assignment, I want to make a bookmarklet to make the website difficult to seen by users. At first I want to make the whole page blur (not specific element but whole page) , so I wrapped whole page in a iframe, clear all the original elements in the body. And then I'd like to use external JS or JQuery blur library to make the whole page in a blur effect.
I tried all the libraries mentioned above, unfortunately, none of them works in this case. (seems like the link of JQuery library didn't work)
I use these lines to add external links in bookmarklet
jscript=document.createElement('script');
jscript.type='text/javascript';
jscript.src='//code.jquery.com/jquery-1.8.1.min.js';
script=document.createElement('script');
script.type='text/javascript';
script.src='http://gianlucaguarini.github.io/Vague.js/Vague.js';
//script.src='//nbartlomiej.github.io/foggy/jquery.foggy.min.js';
document.getElementsByTagName('head')[0].appendChild(jscript);
document.getElementsByTagName('head')[0].appendChild(script);
Then I tried to mess up the style by using the iframe overlay on the original page , and insert a zombie picture in the background (maybe try a gif next time). Some website won't allow iframe for security issue like twitter, git hub, stackoverflow... So this bookmarklet may not works on these websites.
This week our assignment is
Create a “responsive” web page or codepen that responds to some unexpected aspect of the browsing experience.
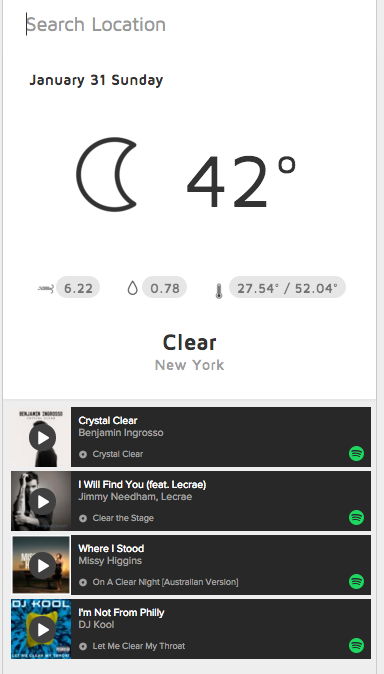
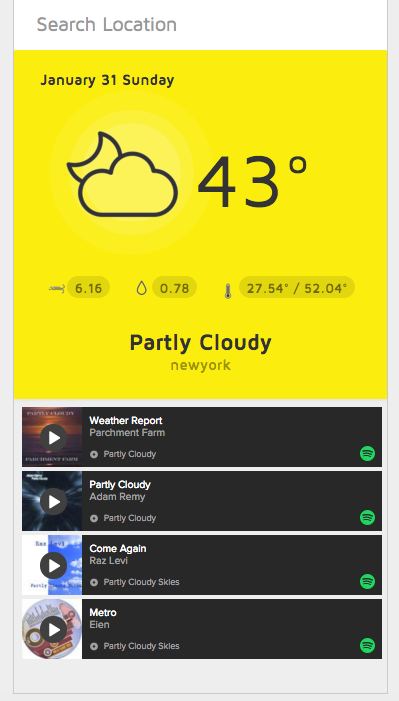
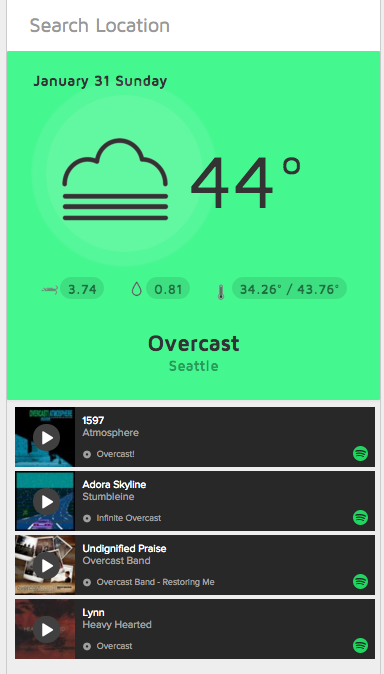
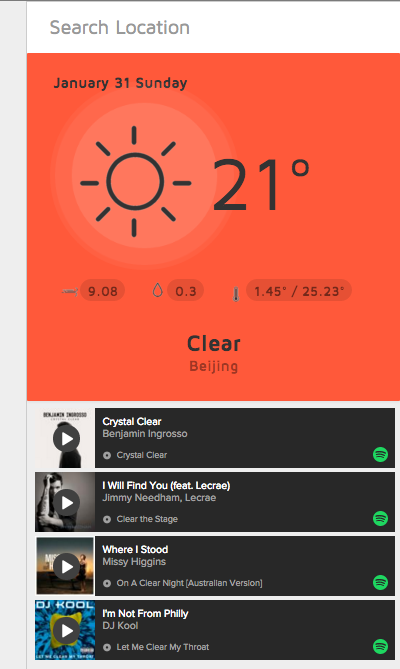
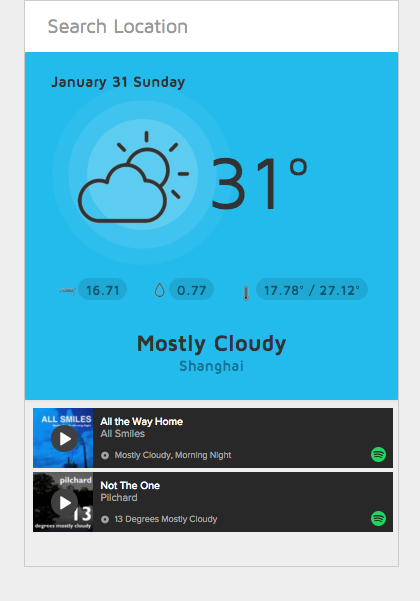
I'd like to make a chrome extension- weather radio, which can provide user the weather forecast in real time base on user's geolocation. And the UI will changed base on the different weather. Meanwhile, sounds related to the specific weather will play.
Next step, I'd like to use css animation to make some animation icon or weather related user interface, hope it can provide more fun.

I like painting and drawing and I'd like to discover more interactive way of drawing. When I was a middle school student, I remember I was always drawing in the class, even exchange each other's notebooks with my friends, and continue their drawing. I think it will be really fun if I can create an online drawing board that everyone can collaborate drawing together.
After decided making a drawing app online, I start to think about fun interact way which can make the drawing experience more interesting. I think about melody. Music is also a beautiful thing in our life, if I can combine this two elements together, It will be really fun.
I mapping the piano key to the canvas, and mapping the frequency from low to high based on the canvas width.
When user drawing on the canvas, the notes will start to play, users can play the sound in a note or in a scale by changing their drawing. After that, their drawing will affect by the gravity and wind power in this world, every time the drawing collide the canvas edge, sound play. It like echo, after user drawing the sound, it will have some random echo to generate beautiful harmony witch may give the user some surprise.
The app can be played by multiple people online. users can also see what other users drawing and heard the sound others made in real time.
I'm using P5 to make the drawing function , sound generation and physical effect, using socket.io , Node.js and Express.js to made the server side and make the drawing board can be played by multiple user in real time.
Website link (so far it does't show well on the website, it will be better to see in iphone 6 size)
What data did you decide to work with? Why were you interested in this data?
For the final project, I decided to work on my personal consumption data which I'm dealing with everyday. I found it's really interesting when I first recorded my consumption behavior 2 years ago. It was a 2 weeks trip to Taiwan, and I recorded everything I spent in that period. Then I found even after a few months, every time when I opened my expense notebook in Taiwan, I can still remember clearly how I spent my days in that 2 weeks. I can also remember how's the commodity price there and how's the life different from my hometown. I didn't have so much time to write diary there, but with the expense recording's help, I can even get my daily routine.
After this experience, I have a habit to record how I spend money every day. I know there are some apps to do that, some banks also have their financial recording system to help users record all transactions on their card, but I don't like to use them. First, I feel they cannot record all my expense behavior if I use other bank's card as well. Second, even some products like Mint can record all my card's transactions, they still cannot get the things I bought with cash. Third, the most import one, sometimes I feel Insecurity if the app ask me to leave my credit or debit card info in their system. So I 'd rather to track all expense data by myself. Before making this app, I use Excel to record.
What were your key design considerations?
After I decided to make this expense app, I thought about why I want to make it so bad although there are already a lot of financial recording apps in the market. Then I found these points.
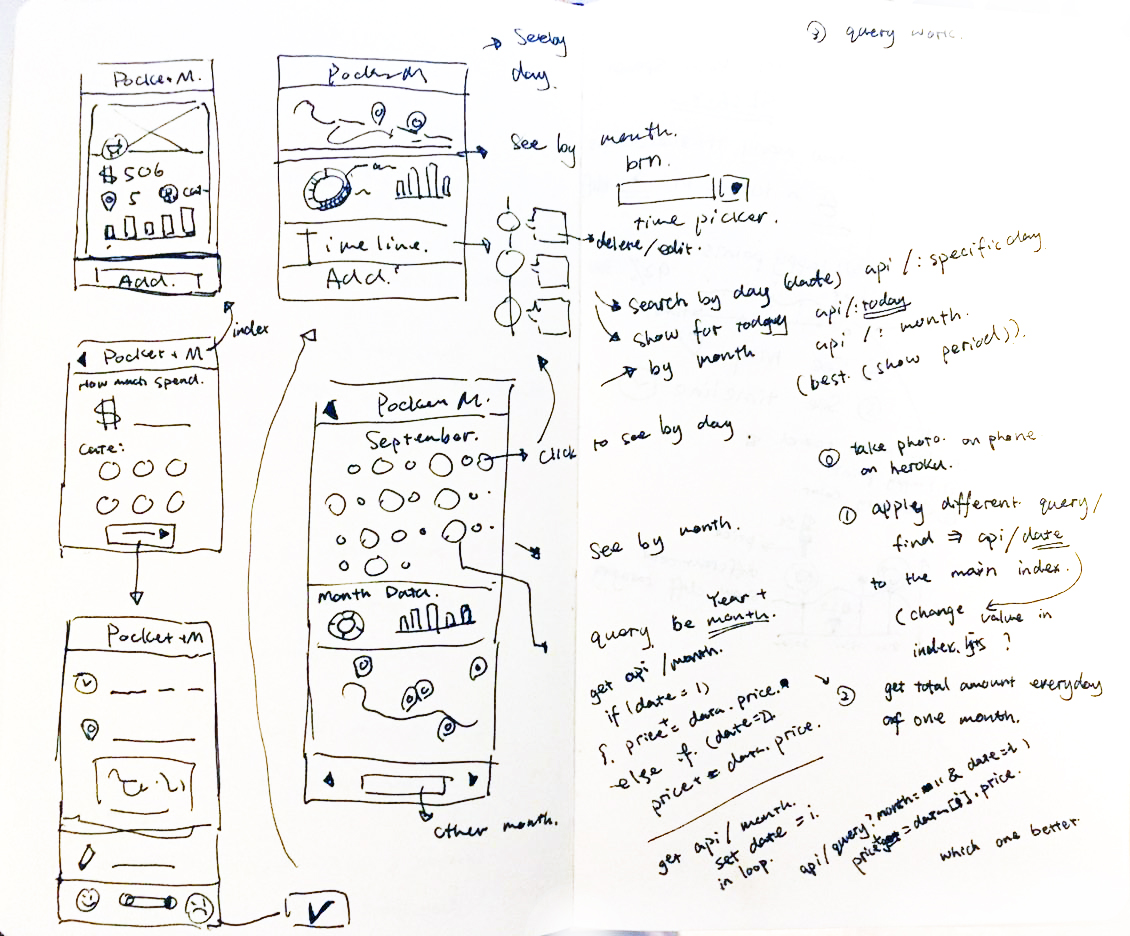
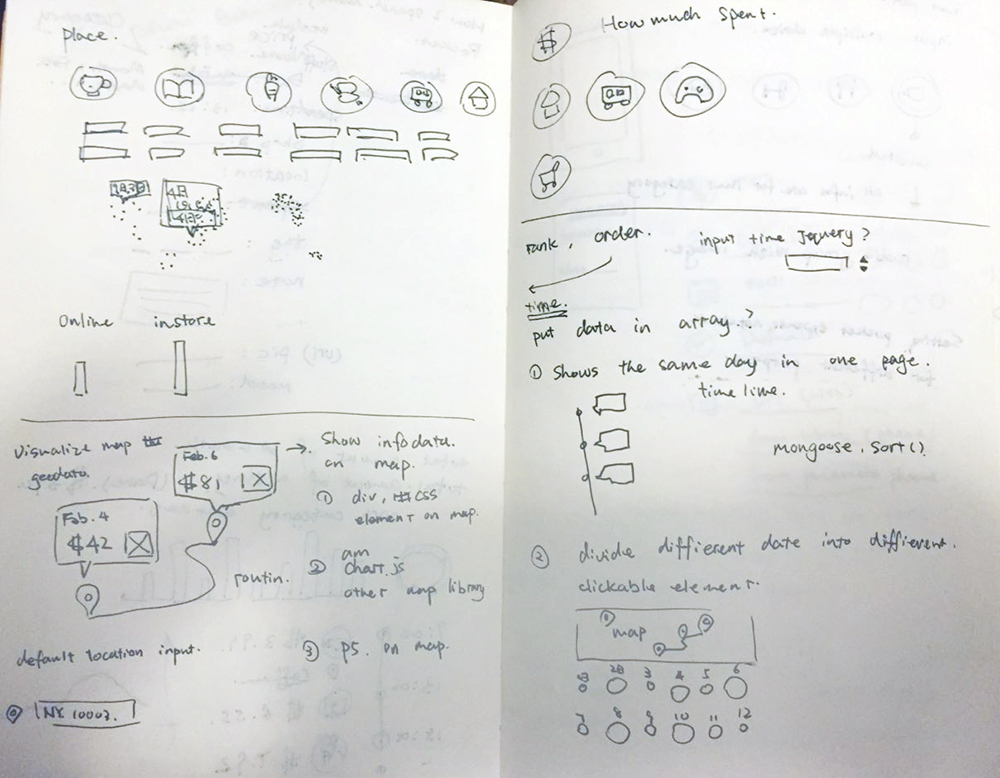
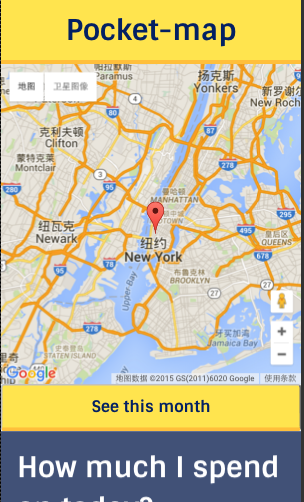
1. I want to record my expense behavior based on map. Because I want to see my daily routine--where I went today, where I'd like to go, where I have a very happy consumption, where I bought an awesome ice-cream that I can recommend to my friends, and of course, where I don't want to go anymore.
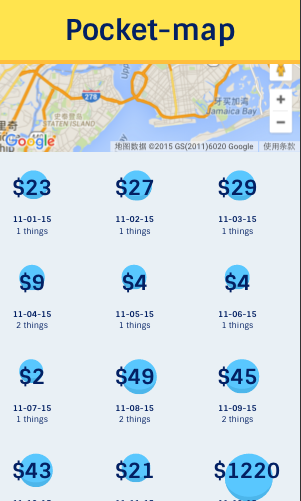
2. I also want to see how I spend by timeline. I want to know about when I usually have meal, when I'd like to have a shopping, when I usually feel satisfy about my consumption.
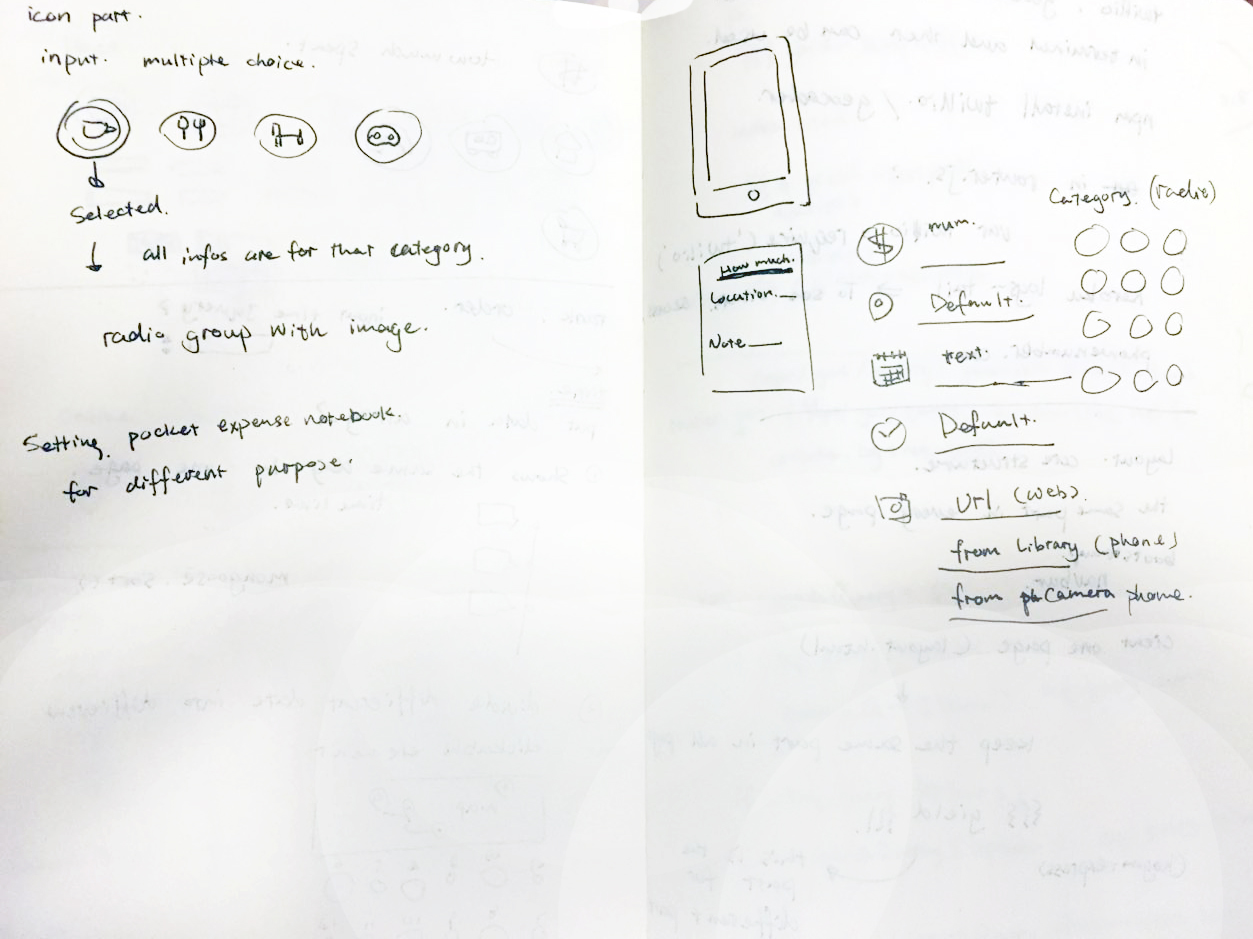
3. Simplify the recording process. When I first came here a year ago, I recorded my expense behavior every day, but then I got lazy to record them day by day and now I just record them by month (by seeing the record from my bank and I lost my cash expense data in this way). Recording data day by day is very annoying even if you just record a few transactions by the end of the day. I realized if I'd like to make a usable expense recording app, I must to make the recording process really really simple just like clicking a button.
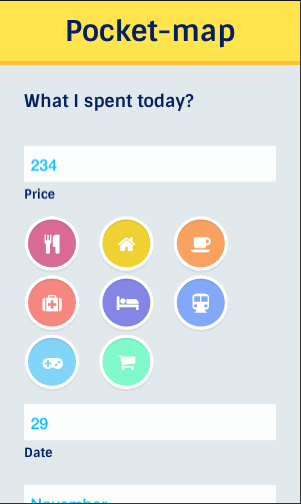
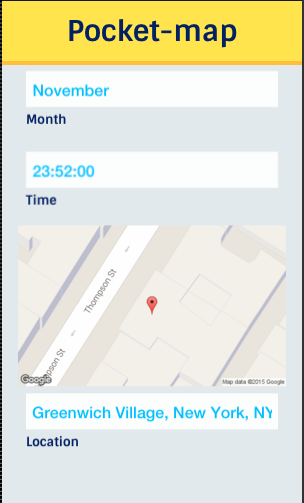
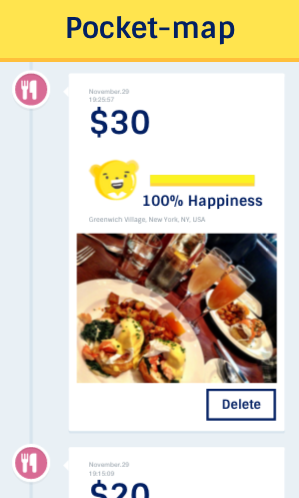
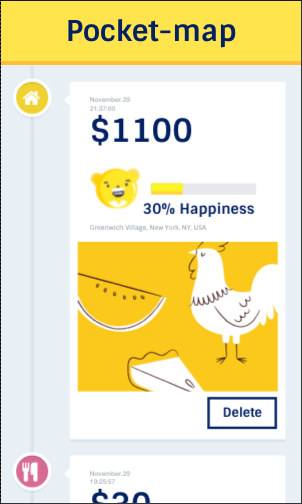
So I decided to make the app automatically set the time and geo data for the user, in this way it 'll be dramatically easier for users to record their expense behavior. User can open the App in the shop where they just finish a transaction. Just input the price value and pick a category, then click the button--Finish Recording!
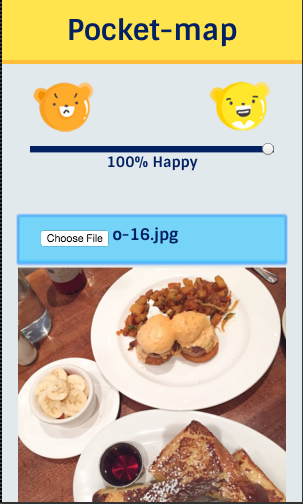
4. Related all my transaction with my emotion. I'd like to track my emotion relationship with my consumption behavior. As you know, most people believe shopping can relieve their pressure while others think consumption makes them more restless. I'd like to see how my emotion changed with my consumption behavior. I'd like to know where is the happiest place I usually have satisfy transaction there; Where is the place I won't go any more; Which shop is AWESOME and I'll go to there again; Which deal is great and make my day.
5. Make the app playable, friendly and reliable.
What are some of the key technology processes you used? What was interesting or tricky?
To make my app easily record the data, I build an API to record the all my expense behavior. The APP running on Heroku with MongoDB as database. I also use Amazon Simple Storage Service(Amazon S3) for the image file saving since Heroku cannot save file.I used google map API to track the geo data and show's my geo info on map.
The tricky part for this project are all the things related to time, maybe it caused by I didn't think clearly at the beginning of the project, the logical way or the time data I decided to record is chaos. I'd like the app can automatically set the time and geo data for the user, but the time which can be readable for user is unreadable for the computer. I also need the data for computer to read and can be used for sort by timeline in a day, month, and year. Maybe it's just caused by I'm not familiar with the time thing and won't be in trouble next time.
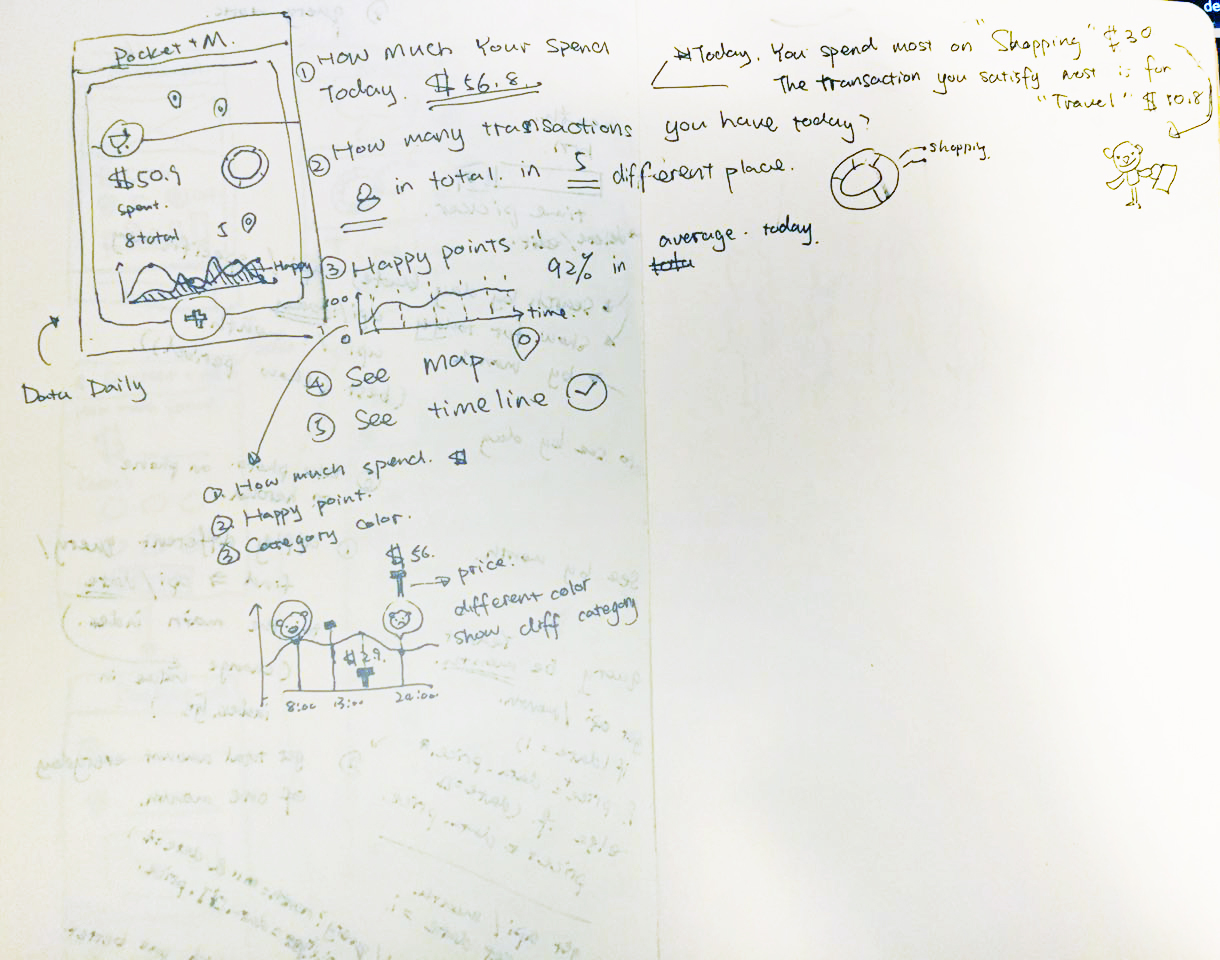
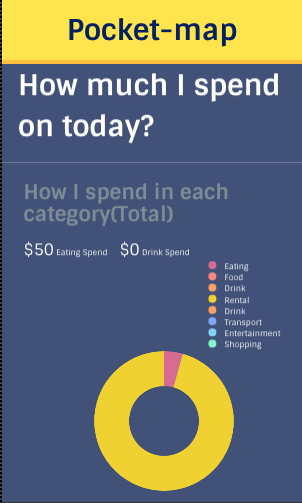
For the visual part, actually I haven't start the visual part, just make the thing works at this time, There are lots of things need to do with visual part. I still want to add more data visualization part for the project (See how I spend by month, How much I spent in total of the month, Which category I spent most on, Which is my happiest day, What's my happy point in this month. )
APP IDEA
API PART
My model coding is here, here's the thing I want to record by the app
var mongoose = require('mongoose');
var Schema = mongoose.Schema;

var spendSchema= new Schema({
price: Number,
stuffname: String,
category: String,
month: String,
sdate: String,
spendtime: String,
shop: String,
location: {
geo: { type: [Number], index: { type: '2dsphere', sparse: true } },
name: String
},
note: String,
url: String,
mood: Number,
timePurchased: Date,
datePurchased:String,
monthPurchased:String,
dateAdded : { type: Date, default: Date.now },
})

module.exports = mongoose.model('Spend',spendSchema);
I use
/api/create/image (post) record the data to my database.
/api/get/:datePurchased (get) this is for getting the data by special date
/api/get (get) this is for getting all transaction
/api/get/:id (get) getting a transaction
/api/update/:id (post) update one transaction
/api/delete/:id (get) delete one transaction
/api/search (get) search data by different key words.
Design Part
Where else could you see this project going?
I'm still working on the project, It has a lot of things to do actually.
1. I want to make the map more playable, it will be more fun if the pin is the bear's head with different emotions and color, you can get the idea by a glance on the map-- where you have the transaction, what's you moods like in that moment and what category.
2. Provide more info analyze on the index page (so far the index is the input form.) I'd like to add more data visualize things.
3. Change the visual style for the app. (Put the bear as the main character for the app )
4. Think about if putting the app to multiple users (add account and login,sign up)
5. Have a place for user to set their daily expense goal.
6.Make it responsive and can be seen correct in different browser and device
For this week's data personalization class, we ask to think about some ideas about the database we 'd like to make. At first, I'd like to make a healthy meal plan app that people can make, collect their meal plan (basic on how many calories and nutritions they had for a meal, and they can also see how other people have for their meal. ) It's more useful for group of people who want to keep healthy or keep fit.

The second idea is what in my bag. People can collect bag's data, what they bring when they work, shopping or study. What they bring if they want to have a trip to other place. They can remember what they bring with them, what the things they like to use, the stories behind the things and they may also know how about other people's bag.
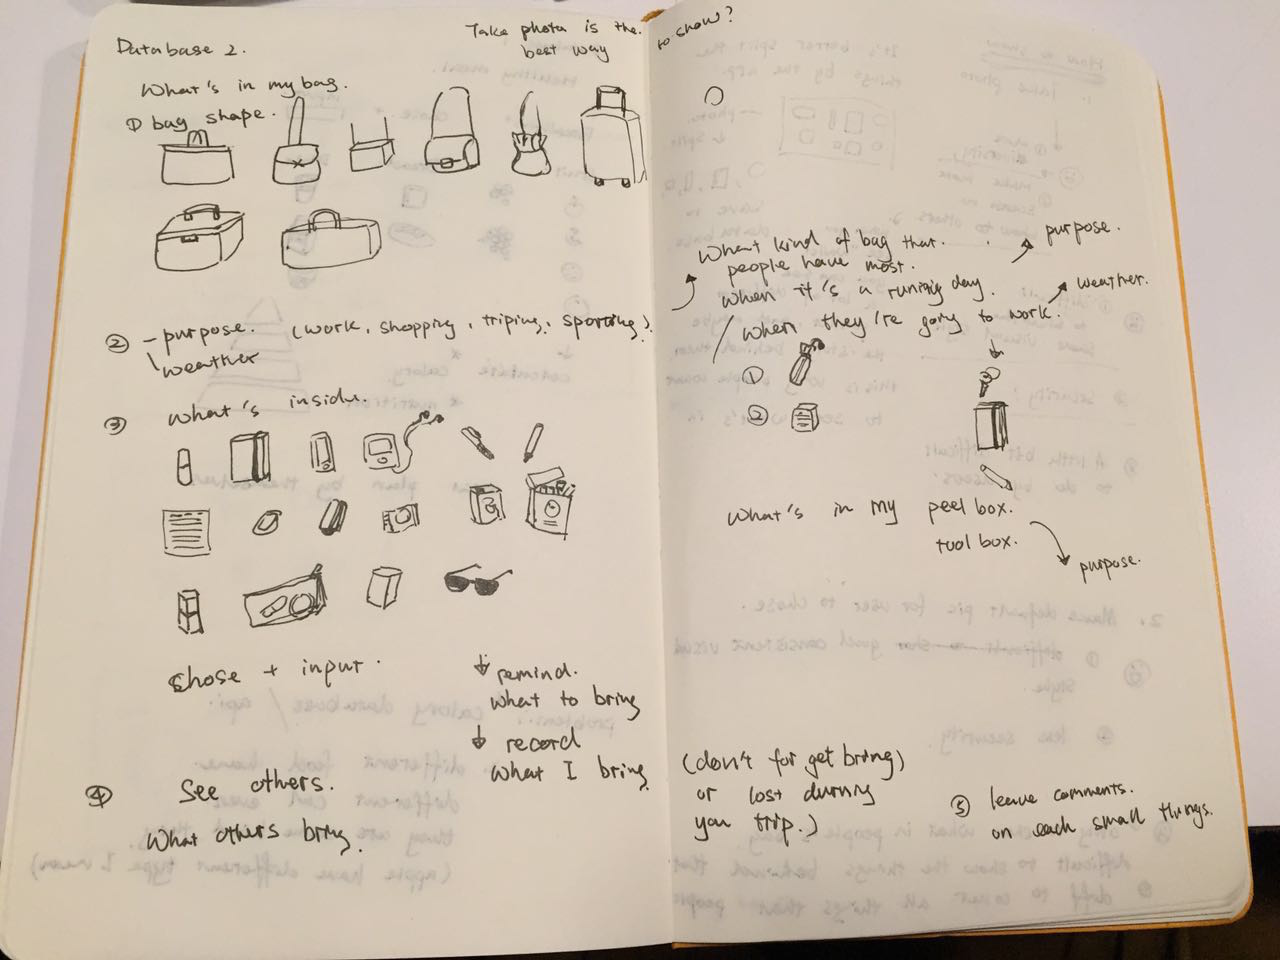
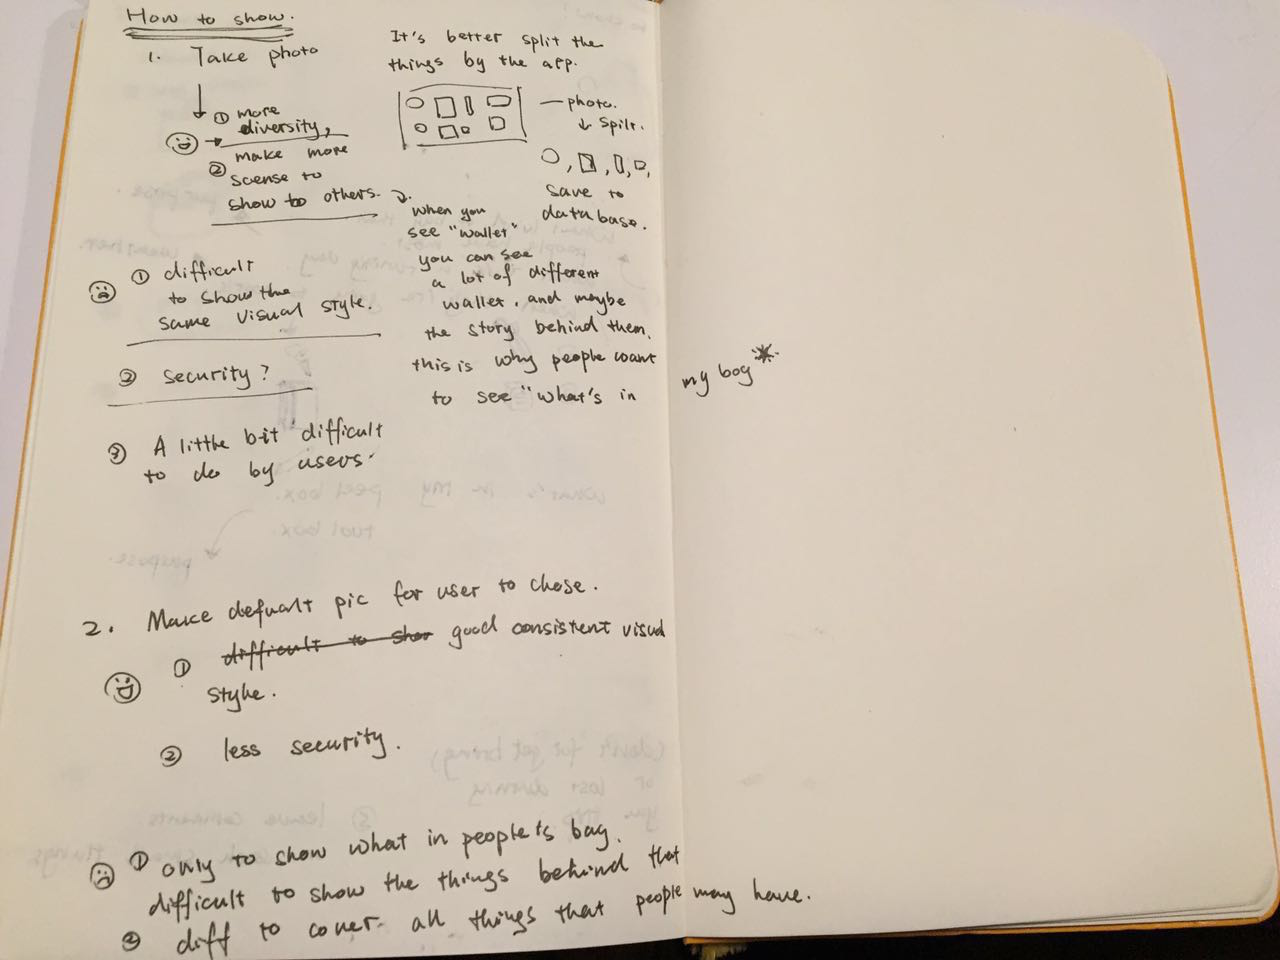
Other ideas based on the second one is how to keep my room clean and neat (you 'll ask to tidy up you stuff on you desk or closet or bookcase) and keep the things you thinks most important for you and keep it in the database. Tidy things is really really a good habit especially when you are living in the city like Manhattan.
Also have an idea about 21 day habit, like you collect the time you do something and grow it as a habit. Haven't think it clearly.
Or I'm also think about collecting some thing about people's shopping habit.. but it's too personality, I'm not sure if there are people like to collect this kind of data in public.
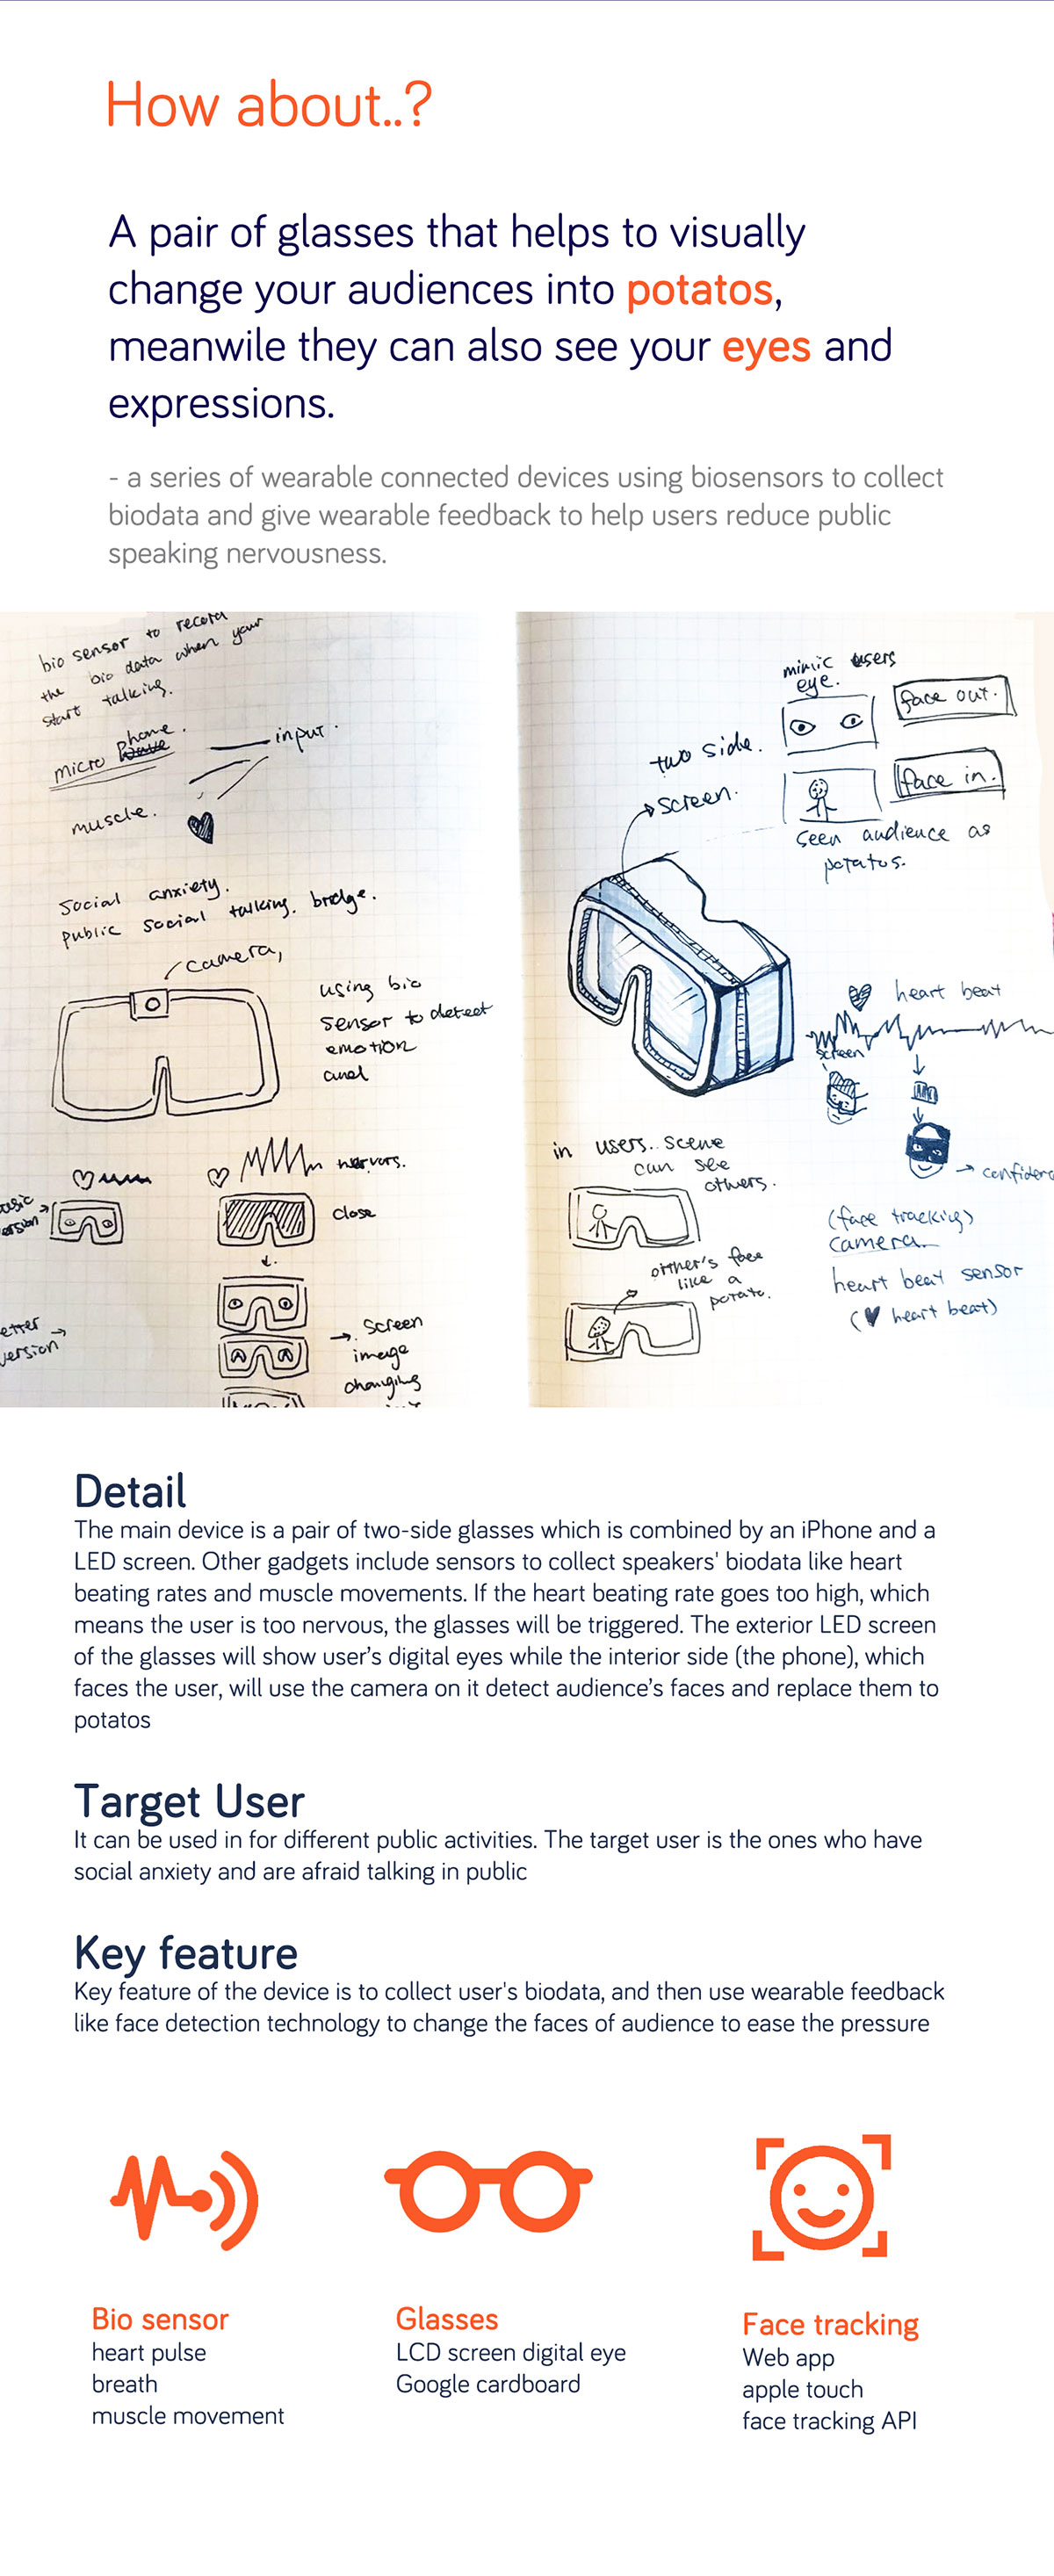
For the midterm, I have bunch of ideas. At first I want to do some thing with face tracking and Video chatting. I think it will be interesting if you talk with familiar friends with unfamiliar faces, and it may also affect the way and the things you are talking about.

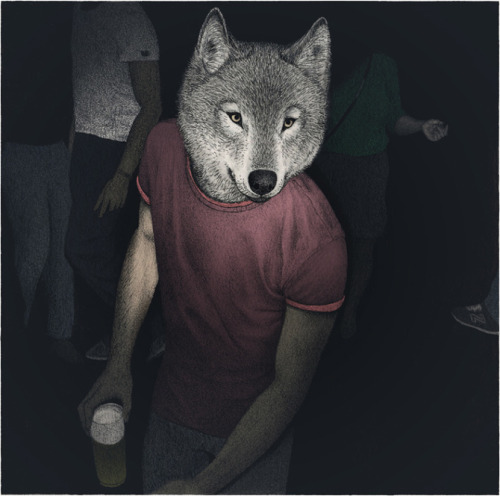
Here are some ideas, for the fifth idea, for example, I'd like to use face tracking library to track people 's face, and detect users' emotion score during the conversation. And also calculate how long he's speaking. If he speak too much or he's getting angry, his head will change to a wolf head or a tiger head. If he has a very happy mood and like listening to others, his face will change to a rabbit or other kind animal's head. I want to use a visual way to translate people's relationship during a conversation. Sometimes we may not have any ideas that we are too ambitious or a little bit impolite in a conversation. This application may help us correct our attitude and change bad emotions in a conversation and help building healthy relationship.
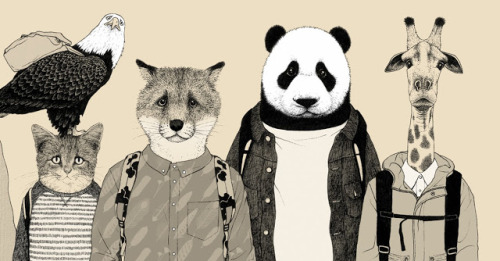
The tricky part for this idea is face tracking won't be reliable all the time, sometime it may have wrong result, and it will affect the experience. And another part is there is noway to calculate people's speaking time. But I like this idea so much..

Another idea I like so much is I want to build a collaborate drawing game, and everything you drew on the canvas can generate notes(music), Other user's drawing elements can have interaction with yours. Every elements in that world have rigid body and have gravity and may also collide with other elements. Every time they collide each other, sound generated.
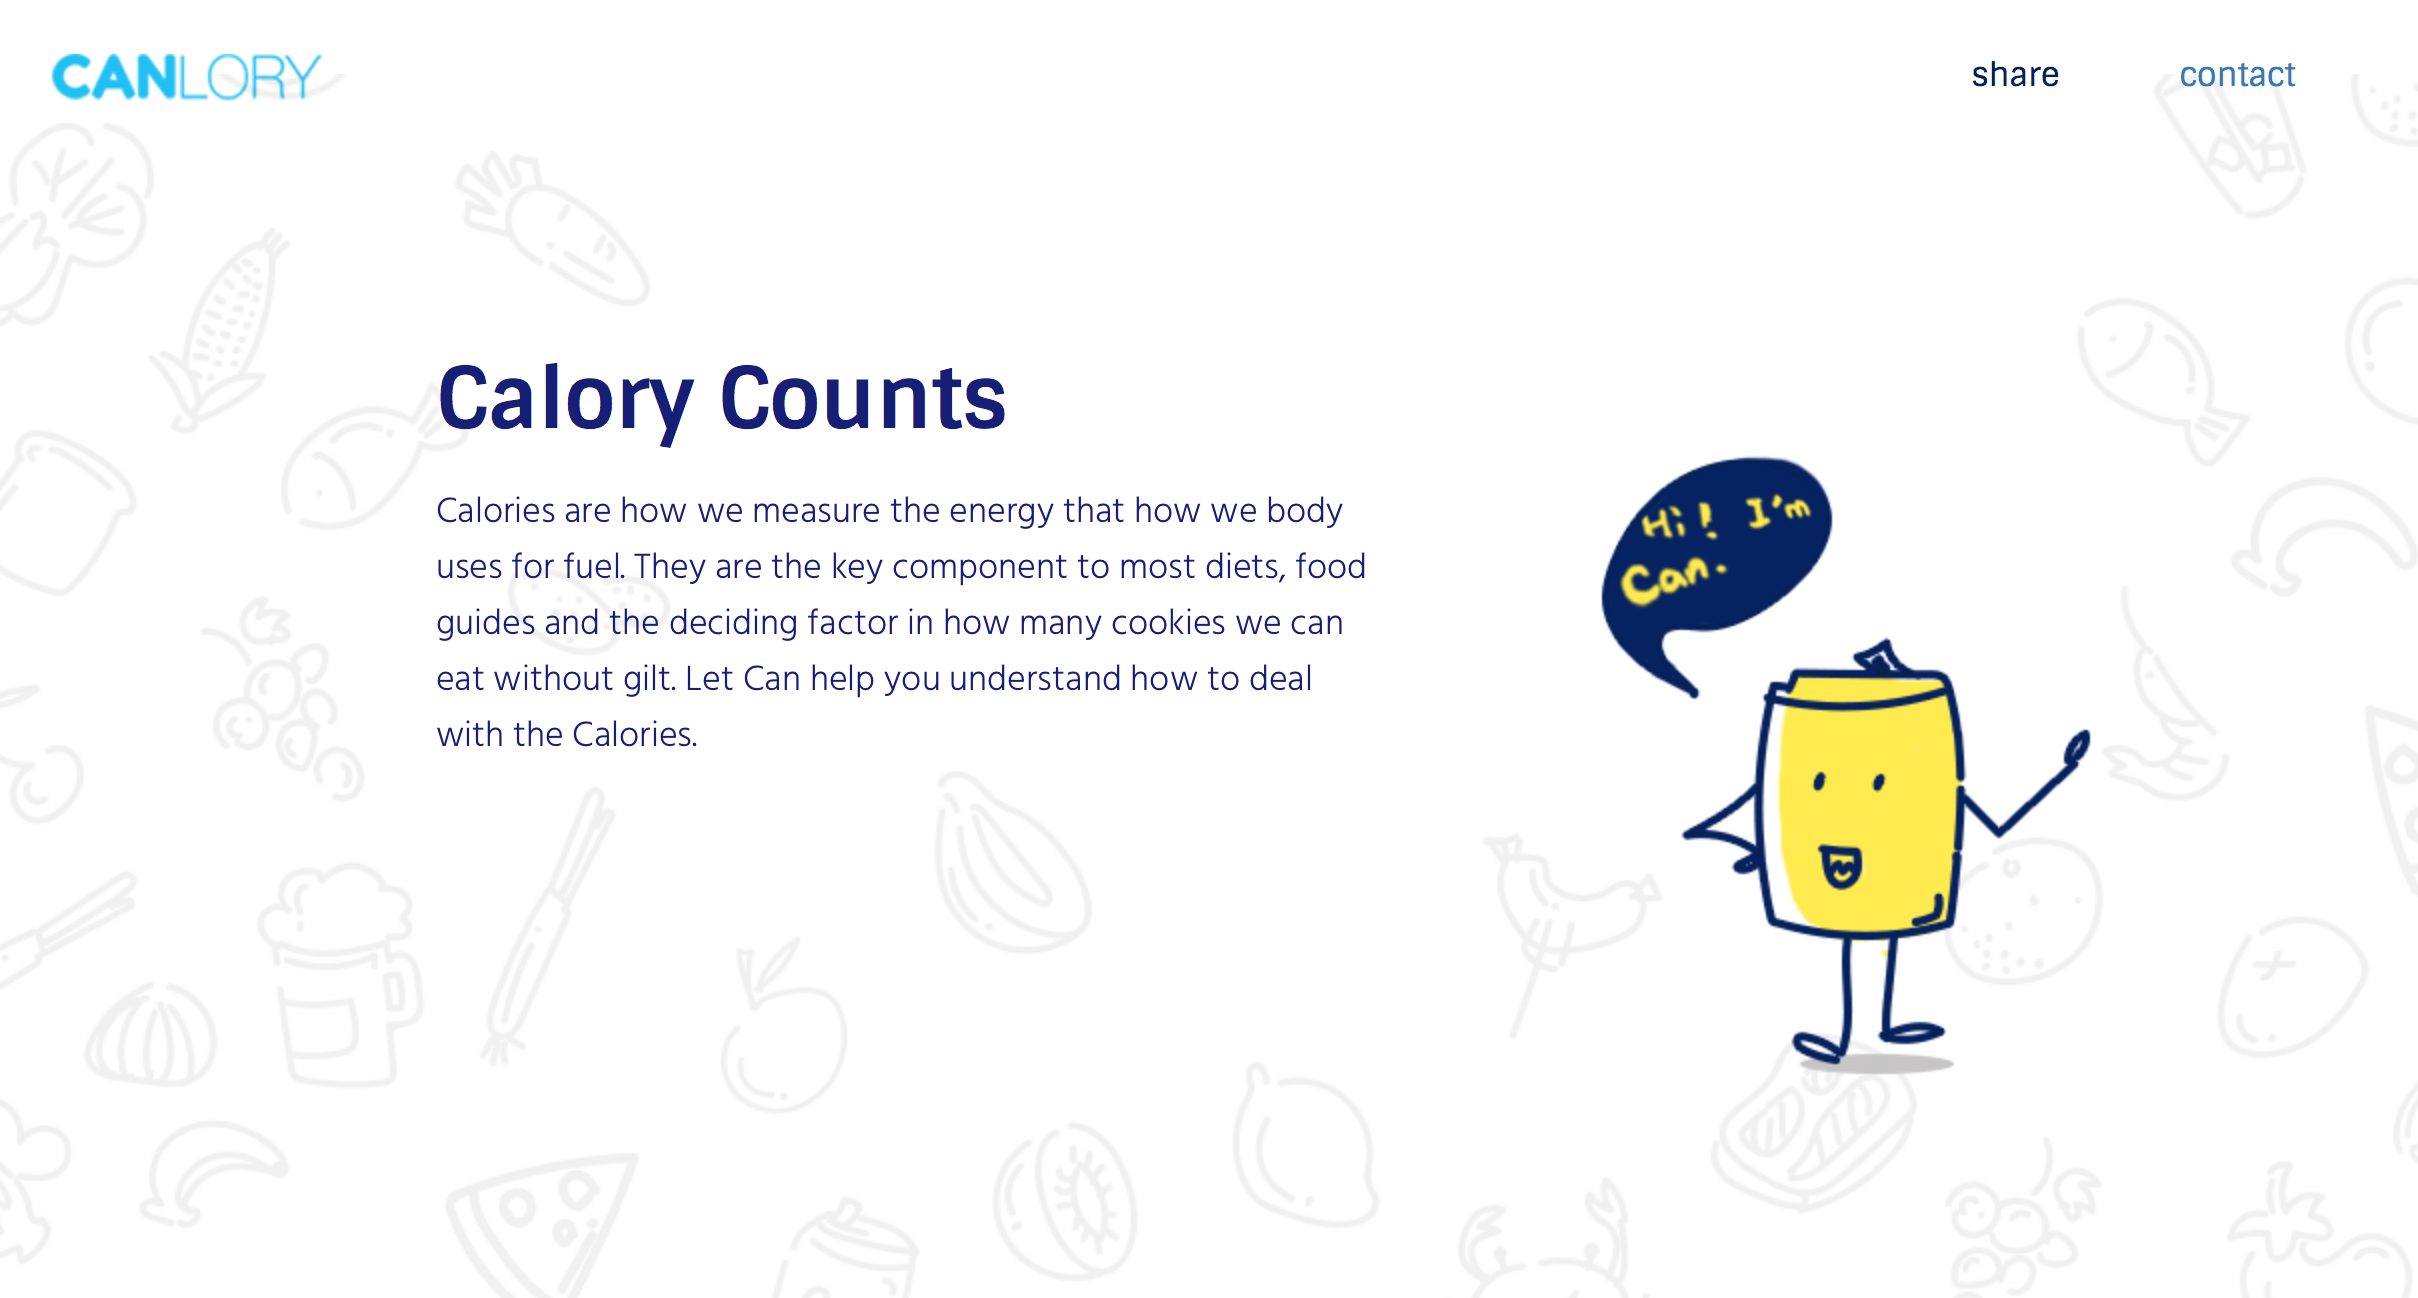
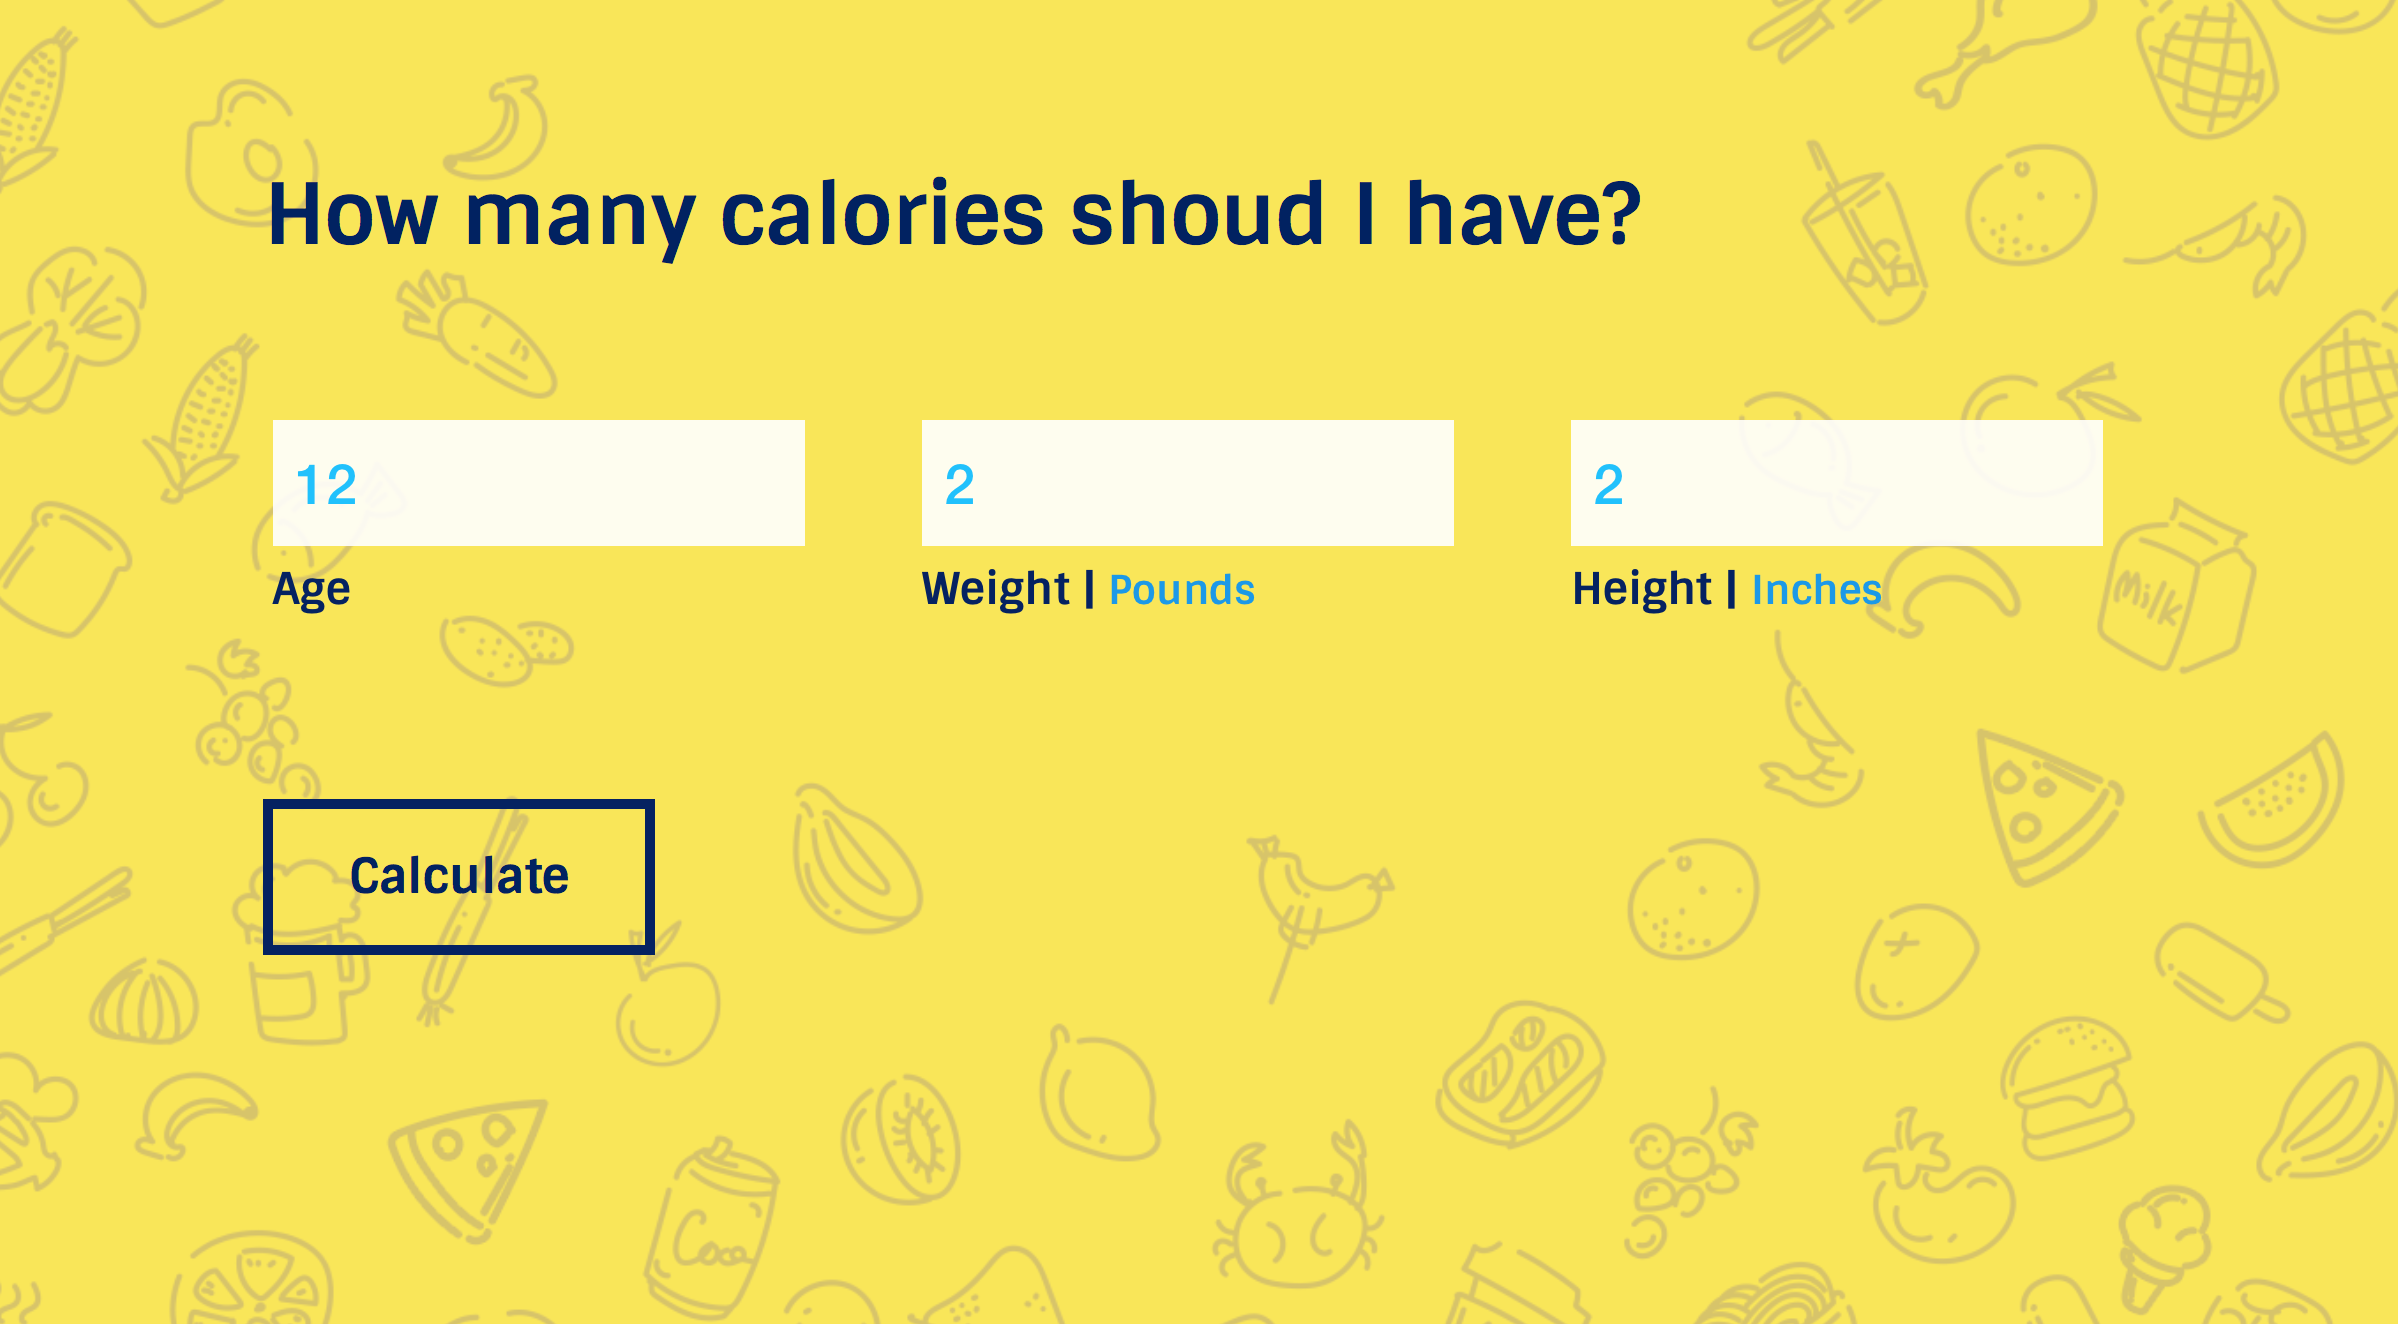
Link here: www.manxue-wang.com:3000/canlory
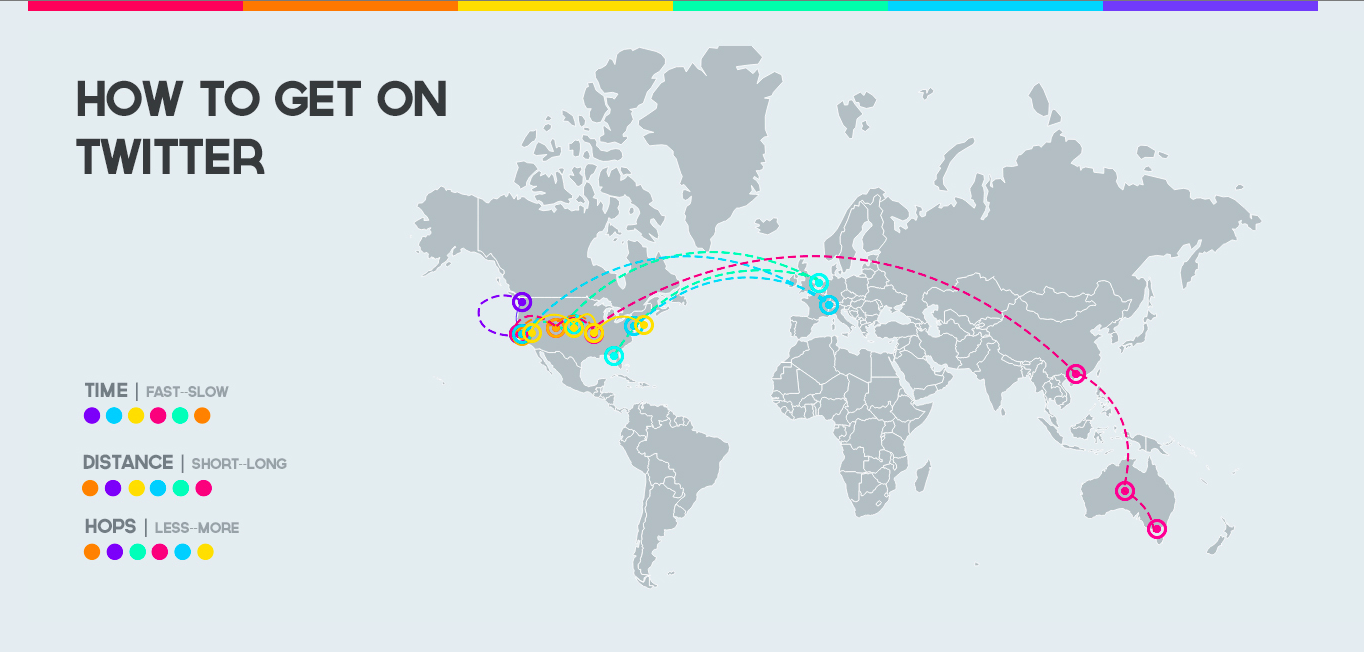
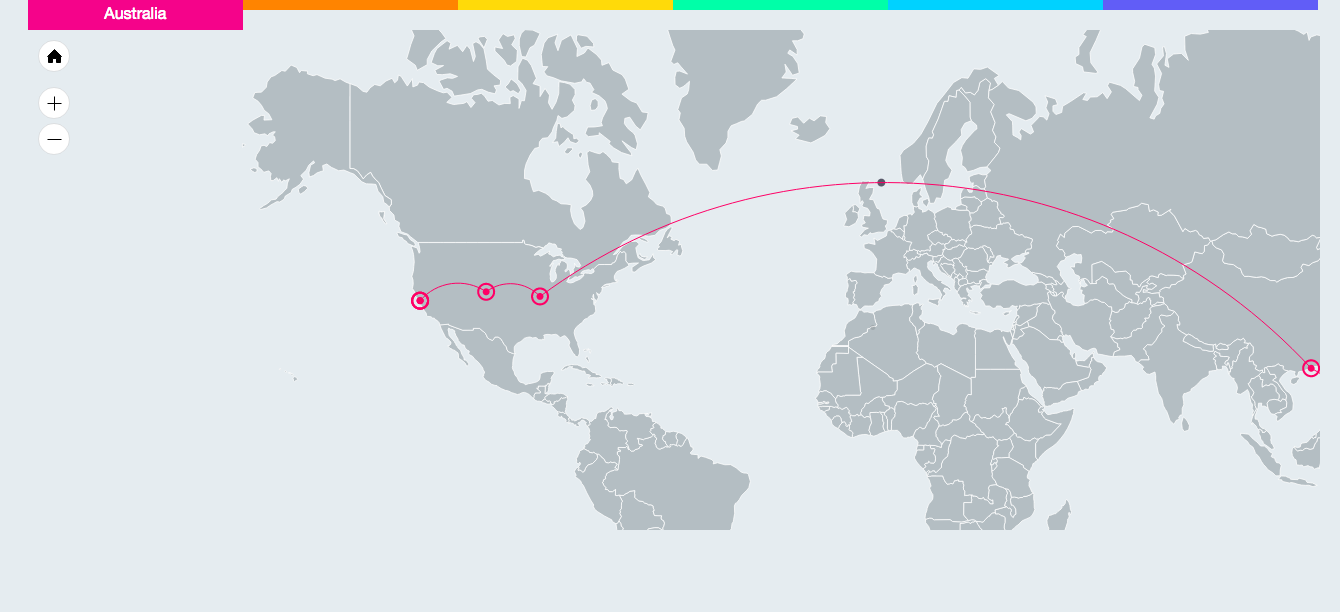
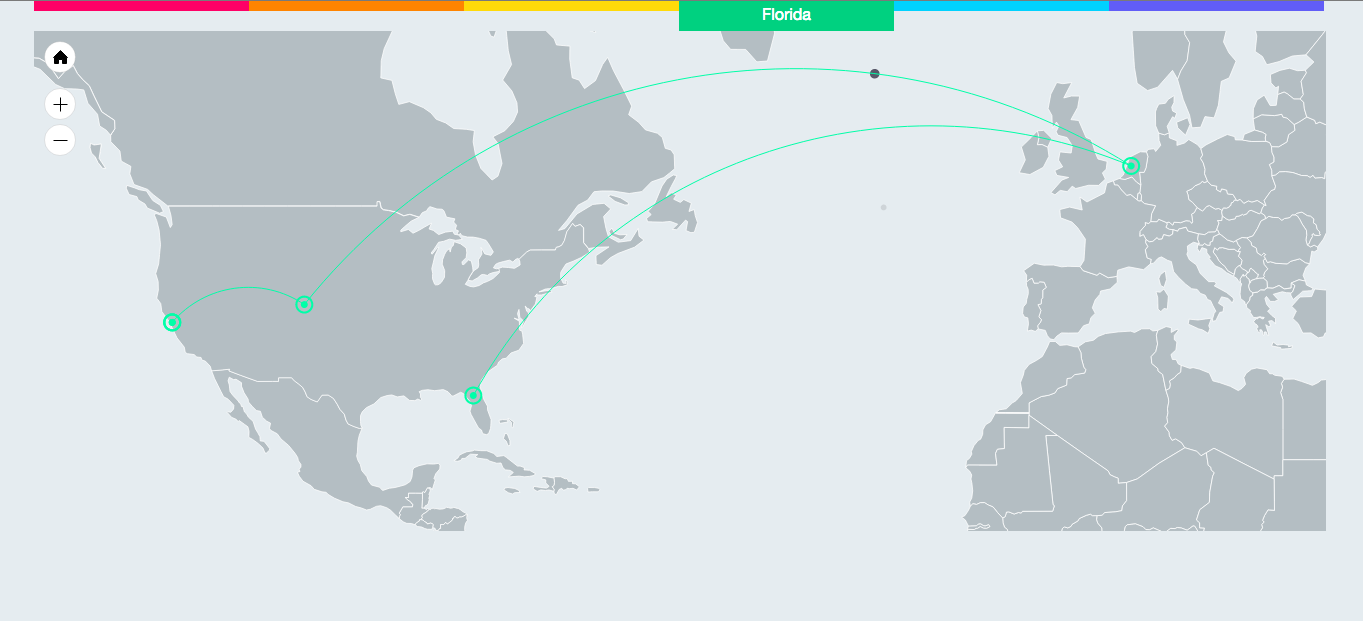
Twitter and Instagram are the social medias people always and always use, so this week I asked my friends who live in different place help me to collect their all router path to get Twitter and Instagram. And I'd like to know how's the physical Intnet path It would be.
At first I ask them use yougetsignal.com to collect their Traceroute and send me the screenshot and the info they get from the site.
I asked 5 friends-->
Alice from Australia

Tianxiao from France

Sabrina from Pittsburgh

Matt from Florida

Cicillia from Seattle

Include myself from NewYork

At first I'm so surprised all the lines are very different, even though they are going to the same target. And then I save all the infos they get to a JSON file, and use IP TRACKER and IP LOCATION to find each IP address's physical location. Then I show this data on the map with amMap's help to see their physical way directly.
I compared their times of HOPS, times to get the target website, and the distance to get the target website. I found usually long distance means long time, but some times also need to consider you intnet's speed. And at first, I think more Hops means long distance and long time, but I totally wrong, someone with high hops value got on the target website so quickly, I think maybe mane hops also means high communication quality in you website.