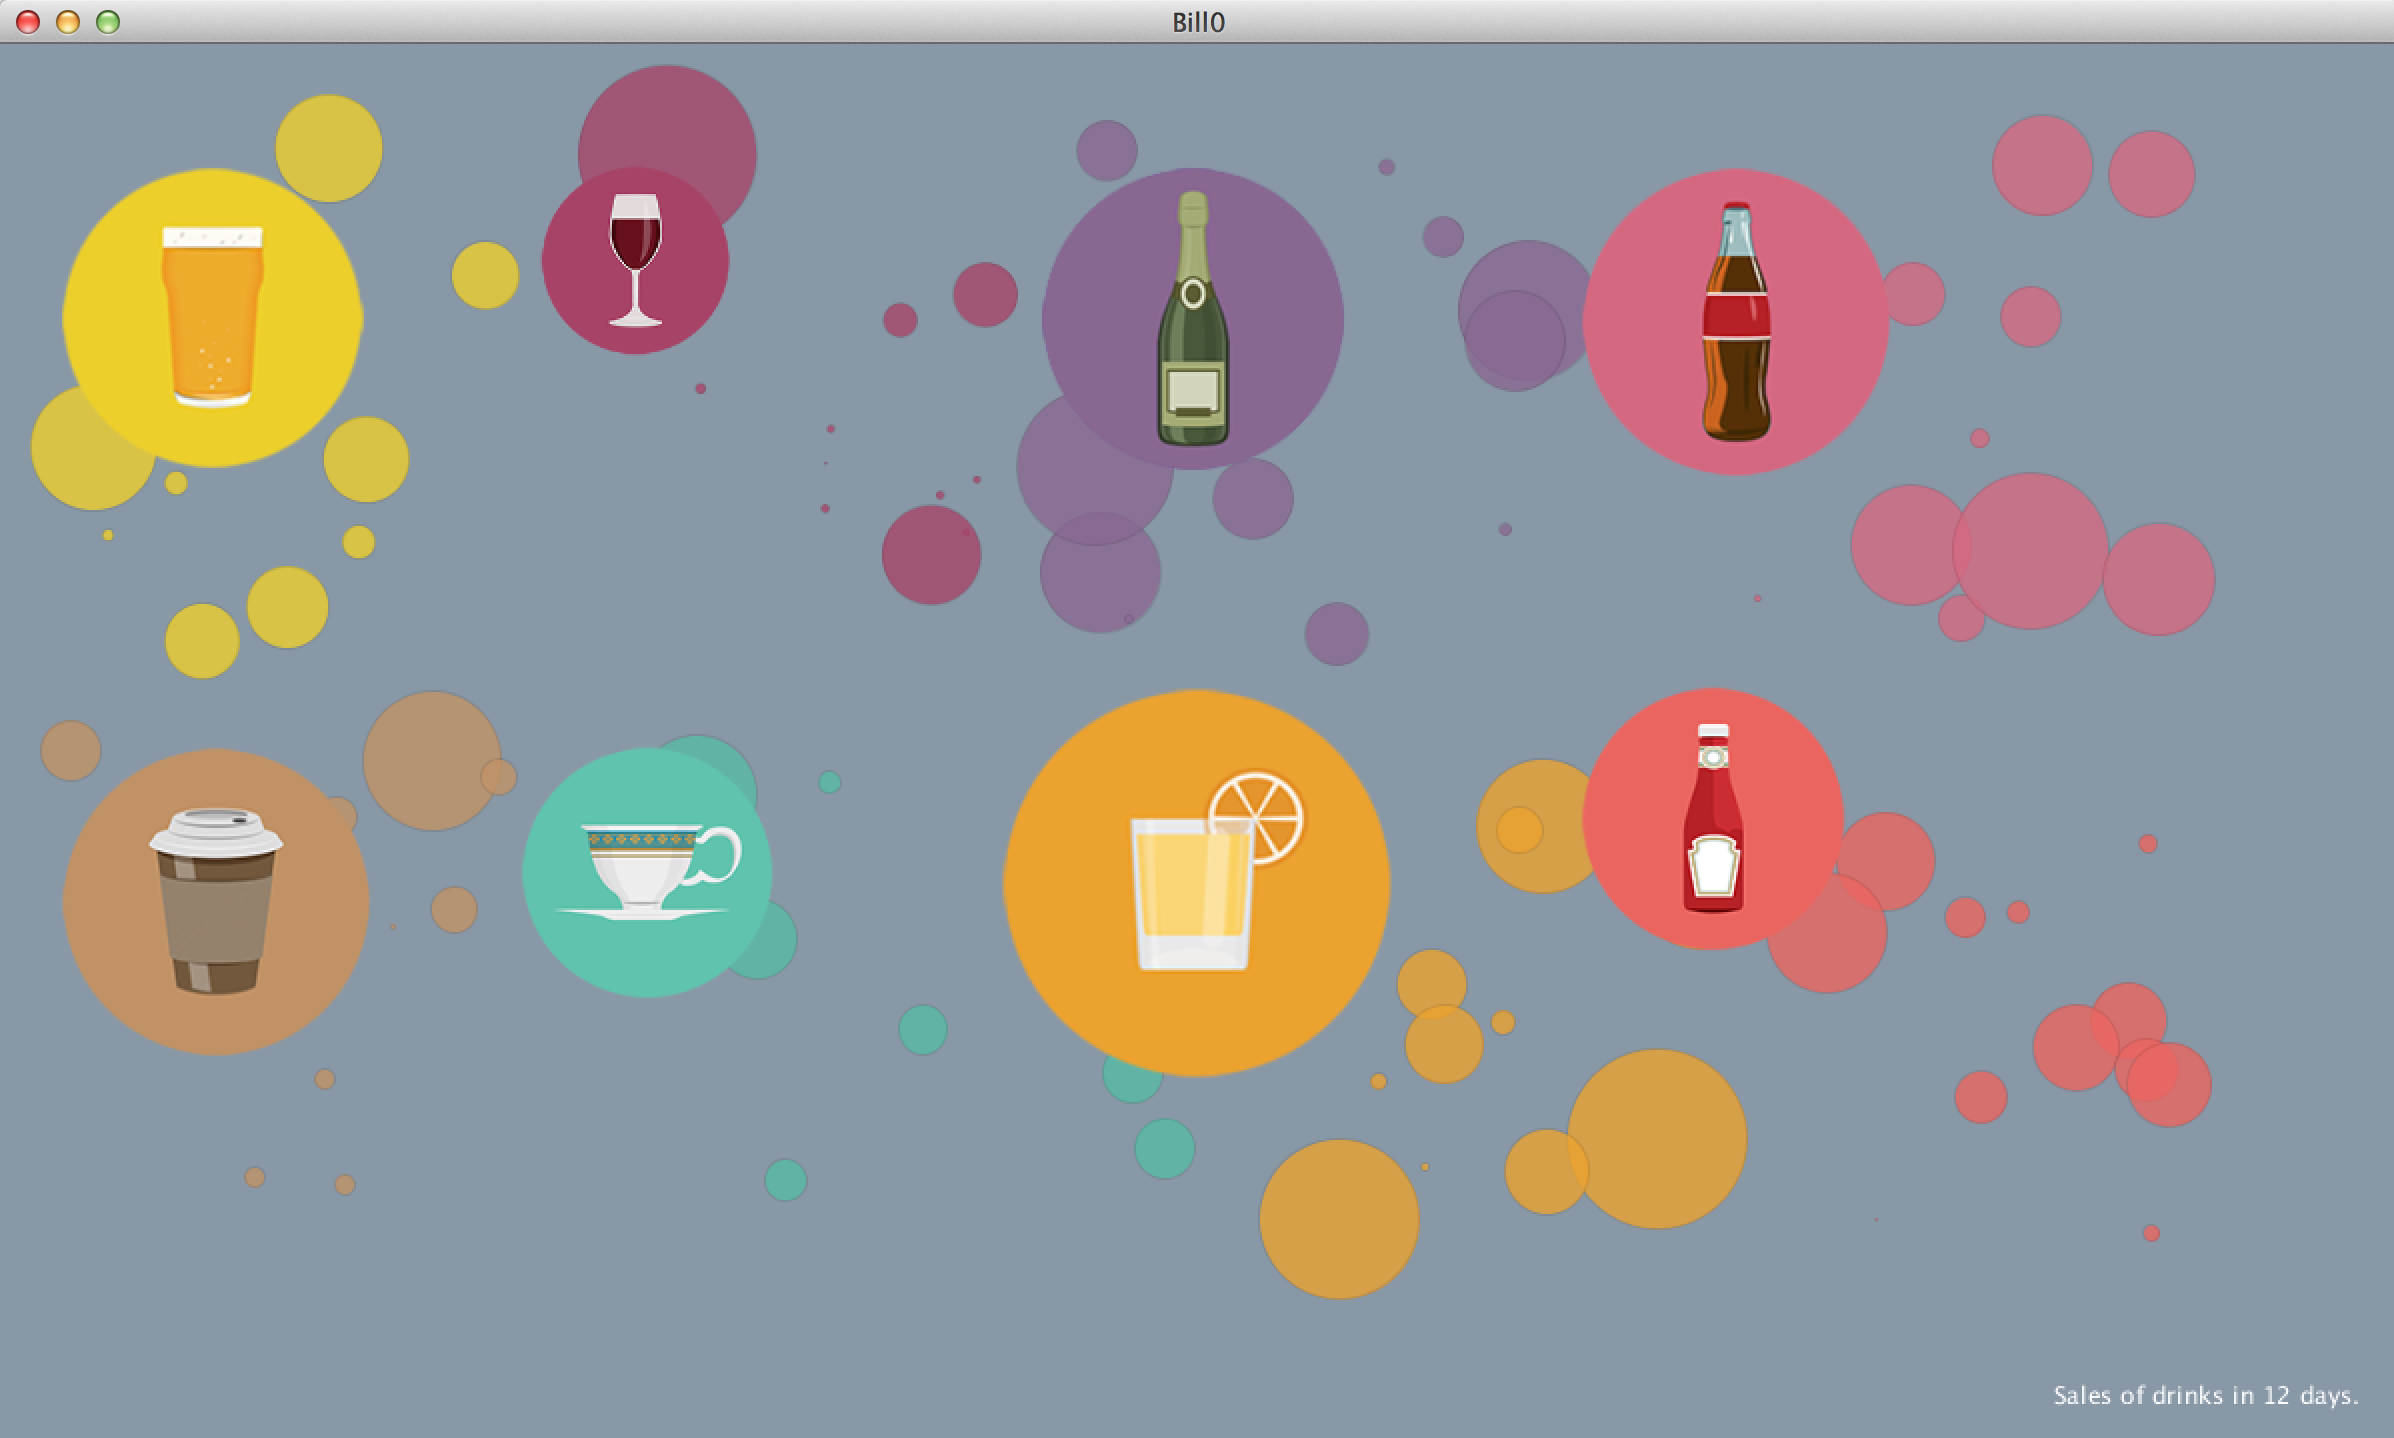
This week 's assignment is about Data, I learned strings, how to calculate words, how to load data from XML, JSON,Table to Processing. I tried to connect with some API but failed... So this sketch just load table (file in .CSV). I used data (sales of drinks in 12 days) in processing, and visualized date in order to make it more readable. And calculated average sales of each brand of drinks, changed drinks image's size according to if it is popular.(popular one is bigger). It's unfinished, still a lot of things should be improved. I'll try to wrote each drink in individual class, then it can be show the pic of drinks when the mouse move over it.


